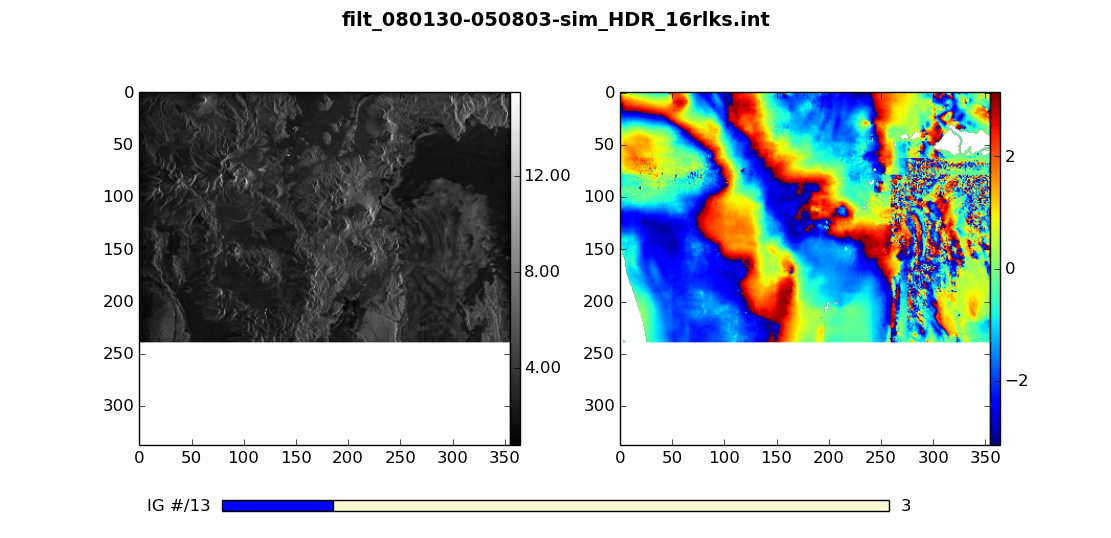
I've posted a simple code that I wrote to browse through a set of interferograms. Single interferograms are easy to view with a variety of software. MDX.pl and RoiView are what I commonly use.
However, it is common to have a directory with 10's or even 100's of interferograms, and in this case it's nice to be able to view them in sequence without lots of windows open. I created roi_browser.py for that purpose.
It's not fancy or blazing fast, but should be easy to install and has some convenient features. I typically use the following command to launch it:
roi_browser.py "int*/filt*unw" -davc
- -d converts unwrapped phase to displacement
- -a displays the amplitude image alongside phase
- -v prints basic metadata to the screen for each interferogram
- -c displays a cursor in the amplitude and phase images